JOURNT$
12-Oct-2024 10:46 PM
Version 3.3.0 released!
COUNTEDJOURNT$ 5$
12-Oct-2024 10:46 PM
Version 3.3.0 released!
Trixology Test

Highest recorded temperature: 41.1 °C on Jul 19, 2022
Lowest recorded temperature: -7.7 °C on Dec 15, 2022
Total recorded temperature range: 48.8 °C

Highest recorded pressure: 1,047.07 mb on Feb 5, 2023
Lowest recorded pressure: 960.48 mb on Nov 2, 2023
Total recorded pressure range: 86.59 mb

Highest recorded wind speed: 50.6 MPH on Apr 5, 2026

Wettest day on record: Sep 18, 2023 with 28.8 mm of rain.

Sunniest day on record: Jul 8, 2026 with 9.1 hours of sunshine.
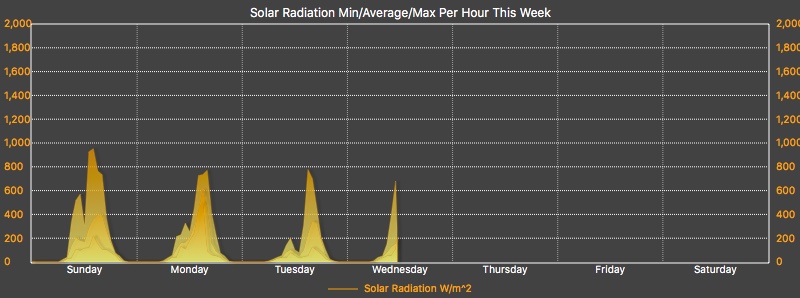
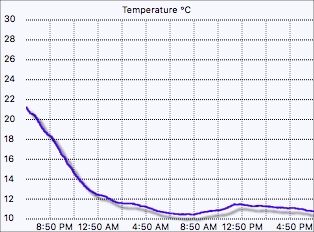
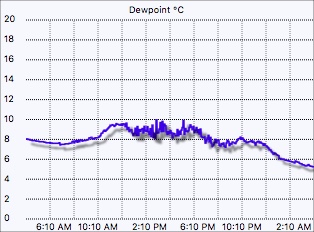
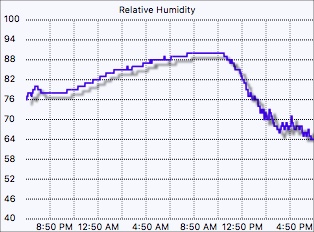
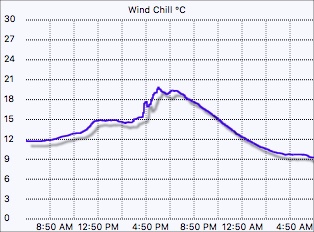
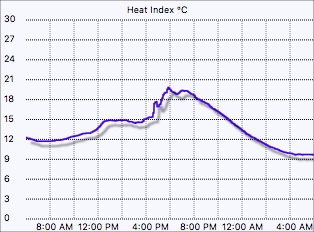
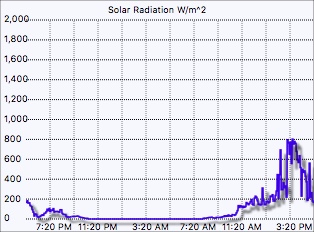
Trixology Test

Temperature (°C)
	Maximum: 28 days: 36.6       7 days: 31.0       24hrs: 27.3       Today: 17.6
	Minimum: 28 days: 10.4       7 days: 10.8       24hrs: 12.2       Today: 15.4
	Average: 28 days: 20.5       7 days: 19.8       24hrs: 19.7       Today: 16.3

Dew Point (°C)
	Maximum: 28 days: 20.9       7 days: 18.9       24hrs: 14.3       Today: 14.0
	Minimum: 28 days: 6.8        7 days: 6.8        24hrs: 7.3        Today: 12.0
	Average: 28 days: 13.7       7 days: 13.0       24hrs: 12.3       Today: 12.7

Heat Index (°C)
	Maximum: 28 days: 38.2       7 days: 31.2       24hrs: 27.3       Today: 17.6
	Minimum: 28 days: 10.4       7 days: 10.8       24hrs: 12.2       Today: 15.4
	Average: 28 days: 20.5       7 days: 19.8       24hrs: 19.7       Today: 16.3

Wind Chill (°C)
	Maximum: 28 days: 36.6       7 days: 31.6       24hrs: 26.8       Today: 17.5
	Minimum: 28 days: 10.2       7 days: 10.5       24hrs: 12.1       Today: 15.2
	Average: 28 days: 20.3       7 days: 19.7       24hrs: 19.4       Today: 16.2

Wind Speed - 10 Minute Gust (MPH)
	Maximum: 28 days: 36.6       7 days: 25.7       24hrs: 13.1       Today: 9.8
	Minimum: 28 days: 1.4        7 days: 2.2        24hrs: 2.5        Today: 2.5
	Average: 28 days: 8.8        7 days: 9.6        24hrs: 6.9        Today: 5.9

Wind Speed - 10 Minute Average (MPH)
	Maximum: 28 days: 21.6       7 days: 15.7       24hrs: 9.3        Today: 5.6
	Minimum: 28 days: 1.4        7 days: 2.2        24hrs: 2.7        Today: 2.8
	Average: 28 days: 6.8        7 days: 7.6        24hrs: 5.4        Today: 4.4

Wind Run (miles)
	 Total:  28 days: 4,539.9    7 days: 1,272.7    24hrs: 128.6      Today: 23.1

Wind Direction (Degrees)
	Average: 28 days: 216.4      7 days: 231.8      24hrs: 198.9      Today: 201.8

Pressure (mb)
	Maximum: 28 days: 1,029.40   7 days: 1,020.36   24hrs: 1,019.44   Today: 1,014.87
	Minimum: 28 days: 1,001.52   7 days: 1,011.43   24hrs: 1,013.53   Today: 1,013.53
	Average: 28 days: 1,019.51   7 days: 1,016.85   24hrs: 1,016.19   Today: 1,013.92

Precipitation (mm)
	Max(/h): 28 days: 0.2        7 days: 0.2        24hrs: 0.0        Today: 0.0
	Totals:  28 days: 0.8        7 days: 0.2        24hrs: 0.0        Today: 0.0

Solar Radiation (W/m^2)
	Max:     28 days: 963        7 days: 899        24hrs: 638        Today: 0
	Average: 28 days: 165.64     7 days: 142.76     24hrs: 127.11     Today: 0.03
Trixology Test

Hour		TempHi	TempLo	HeatHi	HeatLo	ChillHi	ChillLo	DewPHi	DewPLo	HumHi	HumLo	PresHi	PresLo	R/hHi	R/hLo	Rain	AvWsHi	AvWsLo	GustHi	GustLo	WDir	WRun	SolHi	SolLo	UVHi	UVLo
0		17.6	17.3	17.6	17.3	17.5	17.2	14.0	13.5	75	75	1,014.9	1,014.5	0.0	0.0	0.0	5	4	10	4	208	4.7	0	0	0.0	0.0
1		17.2	17.0	17.2	17.0	17.1	16.9	13.5	12.9	75	73	1,014.7	1,014.1	0.0	0.0	0.0	6	5	10	5	210	5.2	0	0	0.0	0.0
2		17.0	16.7	17.0	16.7	16.9	16.6	12.9	12.2	73	71	1,014.2	1,013.7	0.0	0.0	0.0	5	5	9	5	210	5.0	0	0	0.0	0.0
3		16.8	16.1	16.8	16.1	16.6	15.9	12.4	12.0	74	71	1,014.0	1,013.8	0.0	0.0	0.0	5	3	8	3	195	4.2	0	0	0.0	0.0
4		16.1	15.4	16.1	15.4	15.9	15.2	12.8	12.3	80	75	1,014.0	1,013.6	0.0	0.0	0.0	4	3	8	3	192	3.4	0	0	0.0	0.0
5		15.4	15.4	15.4	15.4	15.2	15.2	12.7	12.6	80	80	1,013.7	1,013.5	0.0	0.0	0.0	4	4	7	4	196	0.7	0	0	0.0	0.0

Daily High  	17.6	17.3	17.6	17.3	17.5	17.2	14.0	13.5	80	80	1,014.9	1,014.5	0.0	0.0	0.0	6	5	10	5	-	5.2	0	0	0.0	0.0
Daily Low   	15.4	15.4	15.4	15.4	15.2	15.2	12.4	12.0	73	71	1,013.7	1,013.5	0.0	0.0	0.0	4	3	7	3	-	0.7	0	0	0.0	0.0
Daily Average	16.7	16.3	16.7	16.3	16.5	16.2	13.0	12.6	76	74	1,014.2	1,013.8	0.0	0.0	0.0	5	4	8	4	202	3.8	0	0	0.0	0.0
Daily Total  															0.0						23.1
Trixology Test

Day		TempHi	TempLo	TempAv	HeatHi	HeatLo	HeatAv	ChillHi	ChillLo	ChillAv	DewPHi	DewPLo	DewPAv	HumHi	HumLo	HumAv	PresHi	PresLo	PresAv
1		25.8	11.1	17.5	25.8	11.1	17.5	26.1	10.5	17.4	12.3	6.8	9.5	79	34	57	1,020.4	1,018.6	1,019.5
2		27.3	12.0	19.0	27.3	12.0	19.0	26.8	12.1	18.7	14.3	7.1	11.2	75	35	58	1,020.3	1,014.6	1,017.5
3		17.6	15.4	16.3	17.6	15.4	16.3	17.5	15.2	16.2	14.0	12.0	12.7	80	71	75	1,014.9	1,013.5	1,013.9

Monthly High	27.3	15.4	19.0	27.3	15.4	19.0	26.8	15.2	18.7	14.3	12.0	12.7	80	71	75	1,020.4	1,018.6	1,019.5
Monthly Low 	17.6	11.1	16.3	17.6	11.1	16.3	17.5	10.5	16.2	12.3	6.8	9.5	75	34	57	1,014.9	1,013.5	1,013.9
Monthly Average	23.6	12.8	17.6	23.6	12.8	17.6	23.5	12.6	17.4	13.5	8.6	11.1	78	47	64	1,018.5	1,015.6	1,017.0
Trixology Test

Day		R/hHi	R/hLo	R/hAv	Rain	Snow	AvWsHi	AvWsLo	AvWsAv	GustHi	GustLo	GustAv	WDir	WRun	SolHi	SolLo	SolAv	UVHi	UVLo	UVAv
1		0.0	0.0	0.0	0.0	0.0	13	3	7	21	2	8	233	164.7	881	0	163	5.0	0.0	0.8
2		0.0	0.0	0.0	0.0	0.0	9	3	5	13	2	7	201	125.6	638	0	132	3.0	0.0	0.6
3		0.0	0.0	0.0	0.0	0.0	6	3	4	10	3	6	202	23.1	0	0	0	0.0	0.0	0.0

Monthly High	0.0	0.0	0.0	0.0	0.0	13	3	7	21	3	8	-	164.7	881	0	163	5.0	0.0	0.8
Monthly Low 	0.0	0.0	0.0	0.0	0.0	6	3	4	10	2	6	-	23.1	0	0	0	0.0	0.0	0.0
Monthly Average	0.0	0.0	0.0	0.0	0.0	9	3	6	15	2	7	212	104.5	506	0	98	2.7	0.0	0.5
Monthly Total				0.0	0.0								313.4
Trixology Test

Day		TempHi	TempLo	TempAv	HeatHi	HeatLo	HeatAv	ChillHi	ChillLo	ChillAv	DewPHi	DewPLo	DewPAv	HumHi	HumLo	HumAv	PresHi	PresLo	PresAv	R/hHi	R/hLo	R/hAv	Rain	Snow	AvWsHi	AvWsLo	AvWsAv	GustHi	GustLo	GustAv	WDir	WRun	SolHi	SolLo	SolAv	UVHi	UVLo	UVAv
1		25.8	11.1	17.5	25.8	11.1	17.5	26.1	10.5	17.4	12.3	6.8	9.5	79	34	57	1,020.4	1,018.6	1,019.5	0.0	0.0	0.0	0.0	0.0	13	3	7	21	2	8	233	164.7	881	0	163	5.0	0.0	0.8
2		27.3	12.0	19.0	27.3	12.0	19.0	26.8	12.1	18.7	14.3	7.1	11.2	75	35	58	1,020.3	1,014.6	1,017.5	0.0	0.0	0.0	0.0	0.0	9	3	5	13	2	7	201	125.6	638	0	132	3.0	0.0	0.6
3		17.6	15.4	16.3	17.6	15.4	16.3	17.5	15.2	16.2	14.0	12.0	12.7	80	71	75	1,014.9	1,013.5	1,013.9	0.0	0.0	0.0	0.0	0.0	6	3	4	10	3	6	202	23.1	0	0	0	0.0	0.0	0.0

Monthly High	27.3	15.4	19.0	27.3	15.4	19.0	26.8	15.2	18.7	14.3	12.0	12.7	80	71	75	1,020.4	1,018.6	1,019.5	0.0	0.0	0.0	0.0	0.0	13	3	7	21	3	8	-	164.7	881	0	163	5.0	0.0	0.8
Monthly Low 	17.6	11.1	16.3	17.6	11.1	16.3	17.5	10.5	16.2	12.3	6.8	9.5	75	34	57	1,014.9	1,013.5	1,013.9	0.0	0.0	0.0	0.0	0.0	6	3	4	10	2	6	-	23.1	0	0	0	0.0	0.0	0.0
Monthly Average	23.6	12.8	17.6	23.6	12.8	17.6	23.5	12.6	17.4	13.5	8.6	11.1	78	47	64	1,018.5	1,015.6	1,017.0	0.0	0.0	0.0	0.0	0.0	9	3	6	15	2	7	212	104.5	506	0	98	2.7	0.0	0.5
Monthly Total																						0.0	0.0								313.4
Trixology Test
Temperature (°C) (Maximum)
Jan Feb Mar Apr May June July Aug Sept Oct Nov Dec Annual Av.
2026 11.3 15.6 22.1 24.2 34.6 35.9 36.6 27.3 - - - - 25.93
2025 11.2 15.1 22.6 26.6 28.4 32.3 33.4 32.7 24.6 20.2 17.6 13.8 23.20
2024 14.4 17.2 17.4 20.4 26.3 29.9 29.7 29.7 27.4 19.6 16.3 13.8 21.86
2023 12.6 15.9 16.8 19.9 23.6 31.4 28.0 28.9 32.3 24.8 13.9 14.2 21.86
2022 13.1 15.0 22.1 22.9 25.1 31.1 41.1 34.8 24.9 20.2 16.1 13.6 23.33
Av: 12.5 15.8 20.2 22.8 27.6 32.1 33.7 30.7 27.3 21.2 16.0 13.8 23.23
Temperature (°C) (Minimum)
Jan Feb Mar Apr May June July Aug Sept Oct Nov Dec Annual Av.
2026 -5.6 -1.2 0.7 1.7 3.0 7.6 10.4 11.1 - - - - 3.45
2025 -4.8 -1.2 -1.3 1.2 3.6 6.8 10.0 10.5 4.9 2.3 -3.4 -1.7 2.25
2024 -7.1 -0.8 -1.0 0.4 6.3 6.1 9.2 9.1 3.1 1.4 -3.3 1.6 2.08
2023 -4.4 -2.3 -2.7 -0.7 5.1 7.3 8.8 9.1 7.7 2.6 -2.9 -2.7 2.07
2022 -2.3 1.1 -0.5 -2.8 6.3 6.1 9.3 8.0 4.3 4.1 2.3 -7.7 2.36
Av: -4.8 -0.9 -0.9 -0.0 4.8 6.8 9.5 9.5 5.0 2.6 -1.8 -2.6 2.44
Temperature (°C) (Average)
Jan Feb Mar Apr May June July Aug Sept Oct Nov Dec Annual Av.
2026 4.1 6.7 8.6 10.6 14.3 18.1 20.4 18.1 - - - - 12.60
2025 3.2 5.1 8.1 11.5 14.2 18.2 18.8 18.3 14.2 11.5 8.2 6.9 11.51
2024 4.7 7.9 8.2 9.7 14.6 15.0 17.1 17.5 14.0 11.4 7.3 6.9 11.20
2023 5.1 6.7 6.9 9.1 13.4 17.6 16.4 16.6 17.3 12.3 7.0 7.0 11.27
2022 4.6 7.0 8.4 9.6 13.7 15.9 19.1 19.4 14.6 12.9 8.9 3.7 11.48
Av: 4.3 6.7 8.1 10.1 14.0 17.0 18.4 18.0 15.0 12.0 7.8 6.1 11.61
Heating Degree Days
Jan Feb Mar Apr May June July Aug Sept Oct Nov Dec Annual Tot.
2026 385 275 247 189 121 42 16 3 - - - - 1,277
2025 413 319 262 166 106 38 19 26 87 158 249 298 2,141
2024 365 250 256 205 85 80 42 32 94 158 278 297 2,140
2023 353 273 295 223 114 47 40 34 41 142 284 296 2,140
2022 368 267 254 212 104 65 27 22 85 116 227 398 2,145
Av: 377 277 263 199 106 54 29 23 77 143 259 322 1,969
Cooling Degree Days
Jan Feb Mar Apr May June July Aug Sept Oct Nov Dec Annual Tot.
2026 0 0 2 11 53 89 137 6 - - - - 299
2025 0 0 4 16 33 90 92 82 17 2 0 0 335
2024 0 0 0 2 26 37 60 61 19 1 0 0 206
2023 0 0 0 0 17 79 36 36 64 11 0 0 242
2022 0 0 5 5 17 48 109 112 27 3 0 0 326
Av: 0 0 2 7 29 69 87 59 32 4 0 0 282
Frost Days
Jan Feb Mar Apr May June July Aug Sept Oct Nov Dec Annual Tot.
2026 8 1 0 0 0 0 0 0 - - - - 9
2025 11 6 5 0 0 0 0 0 0 0 7 1 30
2024 8 3 2 0 0 0 0 0 0 0 5 0 18
2023 9 6 5 1 0 0 0 0 0 0 4 5 30
2022 7 0 1 5 0 0 0 0 0 0 0 12 25
Av: 9 3 3 1 0 0 0 0 0 0 4 5 22
Windchill (°C) (Maximum)
Jan Feb Mar Apr May June July Aug Sept Oct Nov Dec Annual Av.
2026 11.3 15.6 22.1 23.8 34.3 36.4 36.6 26.8 - - - - 25.85
2025 11.2 15.1 22.6 26.6 28.4 32.3 33.4 32.7 24.6 20.2 17.6 13.8 23.20
2024 14.4 17.2 17.4 20.4 26.3 29.9 29.7 29.7 27.4 19.6 16.3 13.8 21.86
2023 12.6 15.9 16.8 19.9 23.6 31.4 28.0 28.9 32.3 24.8 13.9 14.2 21.86
2022 13.1 15.0 22.1 22.9 25.1 31.1 38.6 34.7 24.9 20.2 16.1 13.6 23.12
Av: 12.5 15.8 20.2 22.7 27.5 32.2 33.3 30.6 27.3 21.2 16.0 13.8 23.18
Windchill (°C) (Minimum)
Jan Feb Mar Apr May June July Aug Sept Oct Nov Dec Annual Av.
2026 -5.6 -1.2 0.7 0.0 0.6 6.5 10.0 10.5 - - - - 2.69
2025 -4.8 -1.2 -1.3 1.2 3.6 6.8 10.0 10.5 4.9 2.3 -3.4 -1.7 2.25
2024 -7.1 -0.8 -1.0 0.4 6.3 6.1 9.2 9.1 3.1 1.4 -3.3 1.6 2.08
2023 -4.4 -2.3 -2.7 -0.7 5.1 7.3 8.8 9.1 7.7 2.6 -2.9 -2.7 2.07
2022 -2.3 1.1 -0.5 -2.8 6.3 6.1 9.3 8.0 4.3 4.1 2.3 -7.7 2.36
Av: -4.8 -0.9 -0.9 -0.4 4.4 6.6 9.5 9.4 5.0 2.6 -1.8 -2.6 2.29
Windchill (°C) (Average)
Jan Feb Mar Apr May June July Aug Sept Oct Nov Dec Annual Av.
2026 4.1 6.7 8.6 10.2 13.7 17.7 20.2 17.9 - - - - 12.37
2025 3.2 5.1 8.1 11.5 14.2 18.2 18.8 18.3 14.2 11.5 8.2 6.9 11.51
2024 4.7 7.9 8.2 9.7 14.6 15.0 17.1 17.5 14.0 11.4 7.3 6.9 11.20
2023 5.1 6.7 6.9 9.1 13.4 17.6 16.4 16.6 17.3 12.3 7.0 7.0 11.27
2022 4.6 7.0 8.4 9.6 13.7 15.9 19.1 19.4 14.6 12.9 8.9 3.7 11.48
Av: 4.3 6.7 8.1 10.0 13.9 16.9 18.3 17.9 15.0 12.0 7.8 6.1 11.57
Heat Index(°C) (Maximum)
Jan Feb Mar Apr May June July Aug Sept Oct Nov Dec Annual Av.
2026 11.3 15.6 22.1 24.2 38.1 39.9 38.2 27.3 - - - - 27.07
2025 11.2 15.1 22.6 26.6 28.4 34.6 35.9 34.6 24.6 20.2 17.6 13.8 23.75
2024 14.4 17.2 17.4 20.4 26.3 32.0 31.2 32.5 28.7 19.6 16.3 13.8 22.48
2023 12.6 15.9 16.8 19.9 23.6 33.5 28.1 30.3 36.2 24.8 13.9 14.2 22.48
2022 13.1 15.0 22.1 22.9 25.1 32.1 41.4 34.8 24.9 20.2 16.1 13.6 23.43
Av: 12.5 15.8 20.2 22.8 28.3 34.4 35.0 31.9 28.6 21.2 16.0 13.8 23.85
Heat Index(°C) (Average)
Jan Feb Mar Apr May June July Aug Sept Oct Nov Dec Annual Av.
2026 4.1 6.7 9.2 10.6 14.3 18.3 20.4 18.1 - - - - 12.71
2025 3.2 5.2 8.3 11.6 14.2 18.3 18.8 18.4 14.2 11.4 8.1 6.9 11.55
2024 4.8 8.0 8.3 9.8 14.6 15.1 17.1 17.4 14.0 11.5 7.3 7.0 11.25
2023 5.1 6.7 6.9 9.1 13.3 17.6 16.3 16.5 17.3 12.2 7.0 7.0 11.24
2022 4.6 7.0 8.5 9.7 13.7 16.0 19.2 19.4 14.6 12.8 8.9 3.7 11.51
Av: 4.4 6.7 8.2 10.2 14.0 17.1 18.4 18.0 15.0 12.0 7.8 6.1 11.65
Wind Speed (MPH) (Maximum)
Jan Feb Mar Apr May June July Aug Sept Oct Nov Dec Annual Av.
2026 0.0 0.0 0.0 50.6 38.0 34.4 36.6 20.7 - - - - 22.54
2025 0.0 0.0 0.0 0.0 0.0 0.0 0.6 0.0 0.0 0.0 0.0 1.7 0.19
2024 0.0 0.0 0.0 0.0 0.0 0.0 0.0 0.0 0.0 0.0 0.0 0.0 0.00
2023 0.0 0.0 0.0 0.0 0.0 0.0 0.0 0.0 0.0 0.0 0.0 0.0 0.00
2022 1.2 0.0 1.2 0.0 0.0 0.0 0.0 0.0 0.0 0.0 0.0 0.0 0.21
Av: 0.2 0.0 0.2 10.1 7.6 6.9 7.5 4.1 0.0 0.0 0.0 0.4 4.59
Wind Speed (MPH) (Average)
Jan Feb Mar Apr May June July Aug Sept Oct Nov Dec Annual Av.
2026 0.0 0.0 0.0 7.0 6.5 7.8 7.3 6.0 - - - - 4.33
2025 0.0 0.0 0.0 0.0 0.0 0.0 0.0 0.0 0.0 0.0 0.0 0.0 0.00
2024 0.0 0.0 0.0 0.0 0.0 0.0 0.0 0.0 0.0 0.0 0.0 0.0 0.00
2023 0.0 0.0 0.0 0.0 0.0 0.0 0.0 0.0 0.0 0.0 0.0 0.0 0.00
2022 0.0 0.0 0.0 0.0 0.0 0.0 0.0 0.0 0.0 0.0 0.0 0.0 0.00
Av: 0.0 0.0 0.0 1.4 1.3 1.6 1.5 1.2 0.0 0.0 0.0 0.0 0.87
Wind Direction (Degrees) (Average)
Jan Feb Mar Apr May June July Aug Sept Oct Nov Dec Annual Av.
2026 0 0 0 203 214 229 222 215 - - - - 135.5
2025 0 0 0 0 0 0 93 0 0 0 0 0 7.8
2024 0 0 0 0 0 0 0 0 0 0 0 0 0.0
2023 0 0 0 0 0 0 0 0 0 0 0 0 0.0
2022 3 231 91 0 0 0 0 0 0 0 0 0 27.1
Av: 1 46 18 41 43 46 63 43 0 0 0 0 34.1
Wind Run(miles)
Jan Feb Mar Apr May June July Aug Sept Oct Nov Dec Annual Tot.
2026 0.0 0.0 0.0 4,919.1 4,758.6 5,530.9 5,352.3 313.4 - - - - 20,874.3
2025 0.0 0.0 0.0 0.0 0.0 0.0 0.0 0.0 0.0 0.0 0.0 0.0 0.0
2024 0.0 0.0 0.0 0.0 0.0 0.0 0.0 0.0 0.0 0.0 0.0 0.0 0.0
2023 0.0 0.0 0.0 0.0 0.0 0.0 0.0 0.0 0.0 0.0 0.0 0.0 0.0
2022 0.0 0.0 0.0 0.0 0.0 0.0 0.0 0.0 0.0 0.0 0.0 0.0 0.0
Av: 0.0 0.0 0.0 983.8 951.7 1,106.2 1,070.5 62.7 0.0 0.0 0.0 0.0 4,174.9
Pressure (mb) (Maximum)
Jan Feb Mar Apr May June July Aug Sept Oct Nov Dec Annual Av.
2026 1,020.7 1,018.4 1,030.7 1,032.2 1,031.5 1,028.0 1,029.4 1,020.4 - - - - 1,026.41
2025 1,039.6 1,044.9 1,036.3 1,033.5 1,028.6 1,028.4 1,029.0 1,030.4 1,030.6 1,035.5 1,027.7 1,038.2 1,033.55
2024 1,040.0 1,034.3 1,025.0 1,032.3 1,029.7 1,029.4 1,026.3 1,027.2 1,034.3 1,031.8 1,039.1 1,036.5 1,032.15
2023 1,039.5 1,047.1 1,034.4 1,032.0 1,033.6 1,028.5 1,020.6 1,020.3 1,028.5 1,027.3 1,030.9 1,037.6 1,031.69
2022 1,041.6 1,032.8 1,044.0 1,033.9 1,030.8 1,026.1 1,034.1 1,030.9 1,027.0 1,029.5 1,029.1 1,030.4 1,032.50
Av: 1,036.3 1,035.5 1,034.1 1,032.8 1,030.8 1,028.1 1,027.9 1,025.8 1,030.1 1,031.0 1,031.7 1,035.6 1,031.26
Pressure (mb) (Minimum)
Jan Feb Mar Apr May June July Aug Sept Oct Nov Dec Annual Av.
2026 980.8 976.0 992.7 998.0 999.2 990.8 1,001.5 1,013.5 - - - - 994.06
2025 970.5 1,001.4 999.4 994.4 1,003.5 999.2 998.1 994.8 991.3 981.8 988.4 988.0 992.57
2024 972.7 973.1 971.0 989.9 999.4 995.7 997.5 991.8 984.2 986.0 986.3 981.5 985.77
2023 985.2 1,008.6 982.4 983.6 1,008.5 1,003.8 995.0 984.8 992.4 975.8 960.5 982.4 988.58
2022 991.2 977.3 998.6 979.3 1,000.4 1,000.9 1,006.0 1,001.6 995.2 994.0 979.2 984.8 992.37
Av: 980.1 987.3 988.8 989.0 1,002.2 998.1 999.6 997.3 990.8 984.4 978.6 984.2 990.67
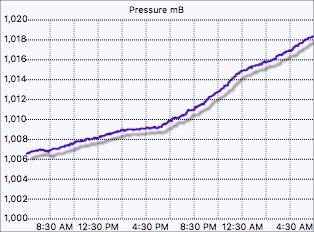
Pressure (mb) (Average)
Jan Feb Mar Apr May June July Aug Sept Oct Nov Dec Annual Av.
2026 1,001.6 1,001.2 1,016.8 1,019.5 1,015.9 1,014.4 1,020.3 1,018.0 - - - - 1,013.47
2025 1,011.6 1,020.8 1,017.1 1,017.9 1,018.6 1,015.6 1,015.7 1,016.4 1,013.7 1,013.1 1,008.5 1,014.0 1,015.27
2024 1,015.7 1,007.8 1,003.9 1,011.8 1,012.7 1,014.4 1,013.7 1,013.2 1,014.7 1,013.4 1,019.4 1,020.3 1,013.43
2023 1,012.5 1,027.3 1,006.4 1,015.9 1,023.3 1,018.6 1,009.8 1,010.5 1,013.9 1,006.3 1,003.2 1,008.6 1,013.02
2022 1,024.3 1,012.7 1,022.2 1,016.2 1,017.8 1,015.8 1,021.1 1,018.7 1,013.5 1,013.0 1,005.5 1,010.3 1,015.91
Av: 1,013.1 1,013.9 1,013.3 1,016.3 1,017.7 1,015.8 1,016.1 1,015.4 1,014.0 1,011.5 1,009.2 1,013.3 1,014.22
Precipitation (mm) (Total)
Jan Feb Mar Apr May June July Aug Sept Oct Nov Dec Annual Tot.
2026 59.8 93.6 25.4 14.8 42.1 38.8 1.2 0.0 - - - - 275.7
2025 51.6 14.2 8.8 8.8 29.4 17.0 38.4 14.6 42.8 37.0 80.4 36.8 379.8
2024 17.2 72.8 51.2 54.4 55.0 26.8 31.6 14.4 67.4 53.4 26.4 40.6 511.2
2023 29.8 5.6 64.2 44.6 24.0 48.4 80.2 23.0 58.8 76.2 46.4 74.8 576.0
2022 25.0 33.4 14.0 8.8 31.8 24.4 13.2 25.0 45.0 44.6 86.2 31.6 383.0
Av: 36.7 43.9 32.7 26.3 36.5 31.1 32.9 15.4 53.5 52.8 59.9 46.0 425.1
Rain Days (>1.00 mm)
Jan Feb Mar Apr May June July Aug Sept Oct Nov Dec Annual Tot.
2026 15 18 6 3 7 10 0 0 - - - - 59
2025 9 4 3 2 4 4 8 3 9 7 15 11 79
2024 3 11 12 10 7 6 4 3 12 8 7 6 89
2023 6 1 17 11 5 5 13 6 9 10 10 14 107
2022 6 9 6 3 7 4 5 6 7 8 14 8 83
Av: 8 9 9 6 6 6 6 4 9 8 12 10 83
Snow (mm) (Total)
Jan Feb Mar Apr May June July Aug Sept Oct Nov Dec Annual Tot.
2026 100.0 0.0 0.0 0.0 0.0 0.0 0.0 0.0 - - - - 100.0
2025 0.0 0.0 0.0 0.0 0.0 0.0 0.0 0.0 0.0 0.0 0.0 0.0 0.0
2024 0.0 0.0 0.0 0.0 0.0 0.0 0.0 0.0 0.0 0.0 20.0 0.0 20.0
2023 0.0 0.0 80.0 0.0 0.0 0.0 0.0 0.0 0.0 0.0 0.0 0.0 80.0
2022 0.0 0.0 0.0 0.0 0.0 0.0 0.0 0.0 0.0 0.0 0.0 0.0 0.0
Av: 20.0 0.0 16.0 0.0 0.0 0.0 0.0 0.0 0.0 0.0 5.0 0.0 40.0
Snow Days
Jan Feb Mar Apr May June July Aug Sept Oct Nov Dec Annual Tot.
2026 2 0 0 0 0 0 0 0 - - - - 2
2025 0 0 0 0 0 0 0 0 0 0 0 0 0
2024 0 0 0 0 0 0 0 0 0 0 1 0 1
2023 0 0 1 0 0 0 0 0 0 0 0 0 1
2022 0 0 0 0 0 0 0 0 0 0 0 0 0
Av: 0 0 0 0 0 0 0 0 0 0 0 0 1
Solar Radiation(W/m^2) (Maximum)
Jan Feb Mar Apr May June July Aug Sept Oct Nov Dec Annual Av.
2026 417 603 926 933 985 1,055 965 881 - - - - 845.63
2025 438 605 865 891 1,005 1,032 1,011 979 875 643 496 253 757.75
2024 330 714 925 1,037 1,118 1,206 1,160 1,079 861 714 418 165 810.58
2023 422 724 923 1,018 1,132 1,252 1,250 1,027 893 684 536 257 843.17
2022 851 926 935 1,037 1,114 1,250 1,209 1,085 960 666 508 227 897.33
Av: 492 714 915 983 1,071 1,159 1,119 1,010 897 677 490 226 830.89
Solar Radiation(W/m^2) (Average)
Jan Feb Mar Apr May June July Aug Sept Oct Nov Dec Annual Av.
2026 15.1 28.0 76.6 121.1 127.0 137.4 164.4 131.3 - - - - 100.12
2025 17.6 31.8 80.7 107.4 88.6 104.1 83.6 65.1 47.1 23.7 22.3 7.6 56.63
2024 17.4 31.8 60.7 82.0 92.6 104.3 84.4 73.0 49.6 33.9 20.1 8.7 54.87
2023 20.4 44.1 61.1 102.1 115.0 129.4 90.3 112.4 66.7 42.5 23.8 9.1 68.07
2022 7.2 27.1 72.8 119.5 106.2 116.9 118.2 109.0 63.4 41.4 18.2 8.0 67.33
Av: 15.5 32.6 70.4 106.4 105.9 118.4 108.2 98.2 56.7 35.4 21.1 8.4 69.40
Sunshine hours (Total)
Jan Feb Mar Apr May June July Aug Sept Oct Nov Dec Annual Tot.
2026 6.9 14.7 76.3 156.4 164.9 168.0 215.8 12.8 - - - - 815.8
2025 11.0 28.4 92.3 110.2 80.1 96.7 65.9 48.3 31.2 5.7 19.1 0.1 589.1
2024 8.3 19.5 50.0 75.1 80.0 87.9 70.5 53.6 31.1 22.2 14.7 0.0 512.9
2023 12.4 42.1 46.0 110.6 107.6 115.8 75.1 33.3 51.4 31.9 20.0 0.0 646.1
2022 2.7 17.9 82.8 128.2 105.0 110.1 119.2 120.3 49.0 40.9 7.2 0.0 783.2
Av: 8.3 24.5 69.5 116.1 107.5 115.7 109.3 53.7 40.7 25.2 15.2 0.0 669.5
U.V. Index (Maximum)
Jan Feb Mar Apr May June July Aug Sept Oct Nov Dec Annual Av.
2026 - - - 4.0 6.0 9.0 5.0 5.0 - - - - 5.80
2025 - - - - - - - - - - - - -
2024 - - - - - - - - - - - - -
2023 - - - - - - - - - - - - -
2022 - - - - - - - - - - - - -
Av: - - - 4.0 6.0 9.0 5.0 5.0 - - - - 5.80
U.V. Index (Average)
Jan Feb Mar Apr May June July Aug Sept Oct Nov Dec Annual Av.
2026 - - - 0.5 0.6 0.6 0.8 0.6 - - - - 0.63
2025 - - - - - - - - - - - - -
2024 - - - - - - - - - - - - -
2023 - - - - - - - - - - - - -
2022 - - - - - - - - - - - - -
Av: - - - 0.5 0.6 0.6 0.8 0.6 - - - - 0.63 August so far has been... Warmer than average (18.07°C versus an average of 17.94) Drier than average (0.00 mm versus an average total of 19.25) Windier than average (a wind run of 313 miles versus an average of 0)
 July was...
	Warmer than average (20.40°C versus an average of 17.86)
	Drier than average (1.20 mm versus an average total of 40.85)
	Windier than average (a wind run of 5,352 miles versus an average of 0)
                                    MONTHLY CLIMATOLOGICAL SUMMARY FOR Aug 2026

NAME: Trixology Test
ELEV: 449.5 Feet  LAT: 052° 42' 01" N  LONG: 001° 24' 00" W

                                    TEMPERATURE (°C)  RAIN (mm)  WIND SPEED (MPH)

                                                  HEAT     COOL              AVG
       MEAN                                       DEG      DEG               WIND                      DOM
DAY    TEMP    HIGH   TIME      LOW    TIME       DAYS     DAYS     RAIN     SPEED    HIGH    TIME     DIR
-------------------------------------------------------------------------------------------------------------
01     17.5    25.8   15:17     11.1   05:37       1.6      2.6     0.00      6.8     20.7    12:29    WSW
02     19.0    27.3   15:39     12.0   03:00       1.3      3.8     0.00      5.4     13.1    15:36    SSW
03     16.3    17.6   00:01     15.4   05:10       0.1      0.1     0.00      4.4      9.8    00:52    SSW
-------------------------------------------------------------------------------------------------------------
       17.6    27.3     2       11.1     1         3.0      6.5     0.00      5.5     20.7      1      WSW

Max >=  25.0:  2
Max <=   0.0:  0
Min <=   0.0:  0
Min <=  -5.0:  0
Max Rain:   0.00 ON 08/03/26
Days of Rain: 0 (>.2 mm) 0 (>2 mm) 0 (>20 mm)
Heat Base:   16.5  Cool Base:   16.5
                                    MONTHLY CLIMATOLOGICAL SUMMARY FOR Jul 2026

NAME: Trixology Test
ELEV: 449.5 Feet  LAT: 052° 42' 01" N  LONG: 001° 24' 00" W

                                    TEMPERATURE (°C)  RAIN (mm)  WIND SPEED (MPH)

                                                  HEAT     COOL              AVG
       MEAN                                       DEG      DEG               WIND                      DOM
DAY    TEMP    HIGH   TIME      LOW    TIME       DAYS     DAYS     RAIN     SPEED    HIGH    TIME     DIR
-------------------------------------------------------------------------------------------------------------
01     18.7    24.3   16:17     13.4   05:44       0.7      2.9     0.00      9.1     19.6    16:19    WSW
02     17.8    22.2   14:44     12.7   23:55       0.5      1.7     0.40     11.0     33.6    09:43    WSW
03     18.6    26.9   16:57     11.0   04:38       1.6      3.7     0.00      8.6     21.5    14:02    WSW
04     19.3    23.1   15:43     15.4   04:33       0.1      2.9     0.00     10.8     24.6    15:18    WSW
05     20.5    28.0   15:44     16.1   05:08       0.0      4.1     0.00      9.5     22.1    13:32    WSW
06     22.5    29.5   13:54     16.6   06:07       0.0      6.0     0.00     11.1     34.7    14:54    WSW
07     22.2    30.1   16:17     16.8   06:08       0.0      5.7     0.00      9.4     26.6    17:37    WSW
08     24.6    33.7   17:06     16.2   05:41       0.0      8.1     0.00      7.2     17.6    15:52    WSW
09     26.7    35.6   16:50     18.6   05:33       0.0     10.2     0.00      6.4     18.2    14:53    SW
10     26.6    36.6   14:58     19.0   05:53       0.0     10.1     0.00      6.7     16.5    11:44    SSW
11     22.6    30.8   14:58     16.9   05:29       0.0      6.1     0.00      5.4     16.5    22:56    S
12     21.8    30.0   14:53     15.7   23:57       0.0      5.3     0.00      6.0     17.1    16:24    S
13     19.2    28.0   15:56     14.0   05:28       0.7      3.5     0.00      5.5     16.5    03:31    S
14     19.6    28.5   15:11     13.7   05:46       0.7      3.8     0.00      5.1     17.3    05:29    S
15     20.0    28.8   16:32     15.0   06:07       0.3      3.9     0.00      4.8     13.1    05:55    S
16     21.1    30.0   17:36     14.6   05:49       0.4      5.1     0.00      4.9     13.7    19:58    SSW
17     19.5    27.8   17:17     13.9   05:17       0.6      3.6     0.00      3.8     14.5    14:18    S
18     17.6    23.8   15:00     12.1   05:27       1.1      2.2     0.00      3.4     12.0    20:25    S
19     17.5    24.6   15:49     12.2   05:54       1.3      2.3     0.00      3.9     12.6    13:45    SSW
20     18.5    26.3   14:44     10.4   05:20       1.5      3.6     0.00      5.4     18.2    14:25    WSW
21     19.2    27.6   17:37     11.9   05:52       1.1      3.7     0.00      4.7     17.3    17:19    SW
22     18.7    25.7   16:27     12.5   05:55       0.9      3.1     0.00      4.5     12.6    11:10    SSW
23     20.1    27.7   14:37     14.4   04:56       0.5      4.1     0.00      7.2     23.2    16:01    WSW
24     19.5    27.7   16:56     13.0   05:46       0.8      3.8     0.00      7.3     22.4    16:39    WSW
25     19.0    27.5   14:07     13.0   05:32       0.9      3.3     0.00     10.0     33.8    13:15    WSW
26     18.8    23.5   14:53     15.5   22:56       0.1      2.4     0.40     12.3     36.6    14:41    WSW
27     19.3    26.7   16:59     14.1   04:13       0.7      3.5     0.40     10.5     25.7    17:48    WSW
28     22.4    28.3   14:43     17.5   05:15       0.0      5.9     0.00      8.1     21.0    15:31    WSW
29     23.0    31.0   14:42     17.4   06:07       0.0      6.5     0.00      8.9     22.4    15:02    WSW
30     19.4    25.1   17:32     15.6   23:51       0.1      2.9     0.00      7.1     20.7    12:37    WSW
31     17.8    26.2   16:04     10.8   06:00       1.4      2.7     0.00      7.0     24.3    14:52    WSW
-------------------------------------------------------------------------------------------------------------
       20.4    36.6    10       10.4    20        16.1    136.9     1.20      7.3     36.6     26      WSW

Max >=  25.0:  25
Max <=   0.0:  0
Min <=   0.0:  0
Min <=  -5.0:  0
Max Rain:   0.40 ON 07/27/26
Days of Rain: 3 (>.2 mm) 0 (>2 mm) 0 (>20 mm)
Heat Base:   16.5  Cool Base:   16.5
                         ANNUAL CLIMATOLOGICAL SUMMARY FOR 2026

NAME: Trixology Test
ELEV: 449.5 Feet  LAT: 052° 42' 01" N  LONG: 001° 24' 00" W


                    TEMPERATURE (°C), HEAT BASE 16.5, COOL BASE 16.5

                          DEP  HEAT  COOL
       MEAN  MEAN        FROM  DEG   DEG                        MAX  MAX  MIN  MIN
YR MO  MAX   MIN   MEAN  NORM  DAYS  DAYS  HI  DATE  LOW  DATE  >=25 <=0  <=0  <=-5
--------------------------------------------------------------------------------------
26  1   6.4   2.0   4.1  -0.3   385     0  11.3  31  -5.6    5    0    0    8    2
26  2   9.0   4.7   6.7   0.0   275     0  15.6  24  -1.2   14    0    0    1    0
26  3  13.5   4.9   8.6   0.5   247     2  22.1  18   0.7   26    0    0    0    0
26  4  17.4   5.2  10.6   0.5   189    11  24.2   8   1.7   13    0    0    0    0
26  5  20.9   9.4  14.3   0.3   121    53  34.6  26   3.0   12   10    0    0    0
26  6  23.9  13.6  18.1   1.1    42    89  35.9  26   7.6    9   10    0    0    0
26  7  27.9  14.5  20.4   2.0    16   137  36.6  10  10.4   20   25    0    0    0
26  8  23.6  12.8  17.6  -0.3     3     6  27.3   2  11.1    1    2    0    0    0
--------------------------------------------------------------------------------------
       17.8   8.4  12.5   0.5  1,277   299  36.6   7  -5.6    1   47    0    9    2


                                       PRECIPITATION (mm)

               DEP.   MAX        DAYS OF RAIN
               FROM   OBS.           OVER
YR MO  TOTAL   NORM   DAY  DATE  0.2   2  20
---------------------------------------------
26  1  59.80   23.12   9.80   9   24  11   0
26  2  93.60   49.68  17.20  28   25  14   0
26  3  25.40   -7.32   5.20  12   15   5   0
26  4  14.85  -11.44   4.95  27    8   3   0
26  5  42.06    5.61  17.10  13   10   6   0
26  6  38.80    7.72   9.80  11   12   5   0
26  7   1.20  -31.72   0.40   2    3   0   0
26  8   0.00  -15.40   0.00   0    0   0   0
---------------------------------------------
      275.71    0.52  17.20   2   97  44   0


                                       WIND SPEED (MPH)

                        DOM
YR MO  AVG.  HI   DATE  DIR
----------------------------
26  1  0.0   0.0    0   N
26  2  0.0   0.0    0   N
26  3  0.0   0.0    0   N
26  4  7.0  50.6    5   WSW
26  5  6.5  38.0   13   WSW
26  6  7.8  34.4   12   WSW
26  7  7.3  36.6   26   WSW
26  8  6.2  20.7    1   WSW
----------------------------
       4.4  50.6    4   SSE
                         ANNUAL CLIMATOLOGICAL SUMMARY FOR 2025

NAME: Trixology Test
ELEV: 449.5 Feet  LAT: 052° 42' 01" N  LONG: 001° 24' 00" W


                    TEMPERATURE (°C), HEAT BASE 16.5, COOL BASE 16.5

                          DEP  HEAT  COOL
       MEAN  MEAN        FROM  DEG   DEG                        MAX  MAX  MIN  MIN
YR MO  MAX   MIN   MEAN  NORM  DAYS  DAYS  HI  DATE  LOW  DATE  >=25 <=0  <=0  <=-5
--------------------------------------------------------------------------------------
25  1   5.9   0.8   3.2  -1.2   413     0  11.2   1  -4.8    9    0    0   11    0
25  2   8.1   2.8   5.1  -1.6   319     0  15.1  21  -1.2   18    0    0    6    0
25  3  14.5   3.5   8.1   0.1   262     4  22.6  20  -1.3   16    0    0    5    0
25  4  18.8   5.9  11.5   1.4   166    16  26.6  30   1.2    7    3    0    0    0
25  5  20.4   9.0  14.2   0.1   106    33  28.4   1   3.6    6    4    0    0    0
25  6  23.9  13.3  18.2   1.3    38    90  32.3  30   6.8    8   13    0    0    0
25  7  24.5  14.3  18.8   0.5    19    92  33.4  11  10.0    3   11    0    0    0
25  8  24.1  13.9  18.3   0.3    26    82  32.7  13  10.5   22    9    0    0    0
25  9  19.3  10.6  14.2  -0.8    87    17  24.6   7   4.9   22    0    0    0    0
25 10  14.4   8.9  11.5  -0.5   158     2  20.2   6   2.3   26    0    0    0    0
25 11  11.0   5.4   8.2   0.3   249     0  17.6   5  -3.4   21    0    0    7    0
25 12   8.6   5.1   6.9   0.8   298     0  13.8   9  -1.7   31    0    0    1    0
--------------------------------------------------------------------------------------
       16.1   7.8  11.5   0.1  2,141   335  33.4   7  -4.8    1   40    0   30    0


                                       PRECIPITATION (mm)

               DEP.   MAX        DAYS OF RAIN
               FROM   OBS.           OVER
YR MO  TOTAL   NORM   DAY  DATE  0.2   2  20
---------------------------------------------
25  1  51.60   14.92  14.00   5   14   7   0
25  2  14.20  -29.72   2.40  15   17   2   0
25  3   8.80  -23.92   2.60  22   10   1   0
25  4   8.80  -17.49   5.20  23    4   2   0
25  5  29.40   -7.05  17.20  27   11   3   0
25  6  17.00  -14.08   7.00   5   10   2   0
25  7  38.40    5.48   8.20   7   10   7   0
25  8  14.60   -0.80   8.60   7    7   1   0
25  9  42.80  -10.70   8.80   4   11   6   0
25 10  37.00  -15.80   9.20   3   17   6   0
25 11  80.20   20.35  21.20  14   27  11   1
25 12  36.60   -9.35   9.00  18   19   8   0
---------------------------------------------
      379.40   -1.73  21.20  11  157  56   1


                                       WIND SPEED (MPH)

                        DOM
YR MO  AVG.  HI   DATE  DIR
----------------------------
25  1  0.0   0.0    0   N
25  2  0.0   0.0    0   N
25  3  0.0   0.0    0   N
25  4  0.0   0.0    0   N
25  5  0.0   0.0    0   N
25  6  0.0   0.0    0   N
25  7  0.0   0.6    1   N
25  8  0.0   0.0    0   N
25  9  0.0   0.0    0   N
25 10  0.0   0.0    0   N
25 11  0.0   0.0    0   N
25 12  0.0   1.7   31   N
----------------------------
0.0 1.7 12 N WCAM$
WCAM320$
MOVIE$
Time-lapse movie
DAILY_MOVIE$
Daily time-lapse movie


Note: There's no U.V. sensor on the station here.